


The U.S. economy enters the back half of 2026 with enough momentum to avoid a baseline recession, but not enough cushion to feel especially comfortable. Consensus forecasts still point to positive real GDP growth this year, and the Federal Reserve’s June projections show growth near 2.2% with unemployment still low by historical standards.1 That is not a recessionary setup. It is, however, an economy with more stress beneath the surface than the headline numbers suggest.
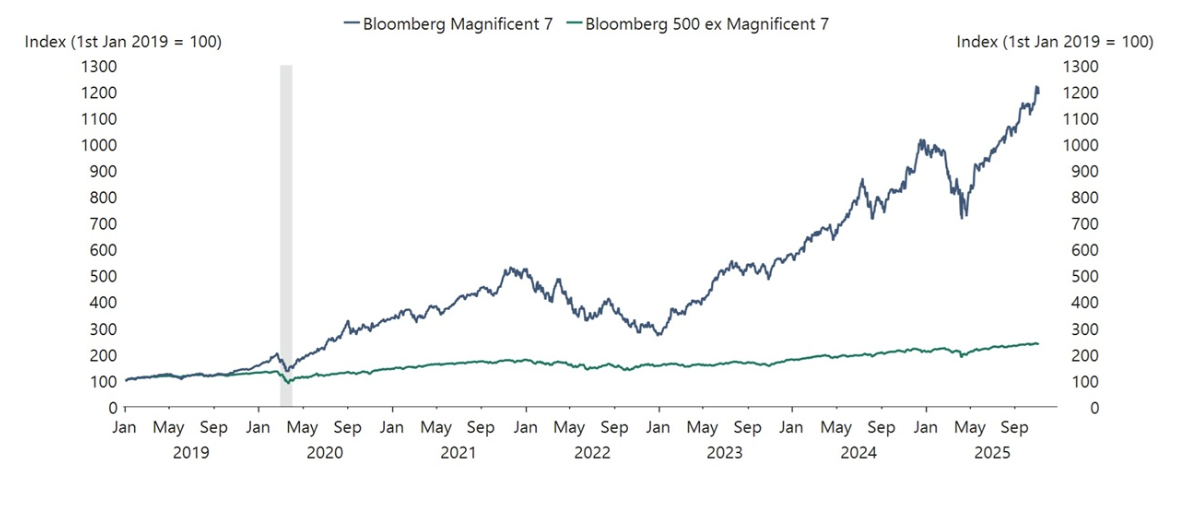
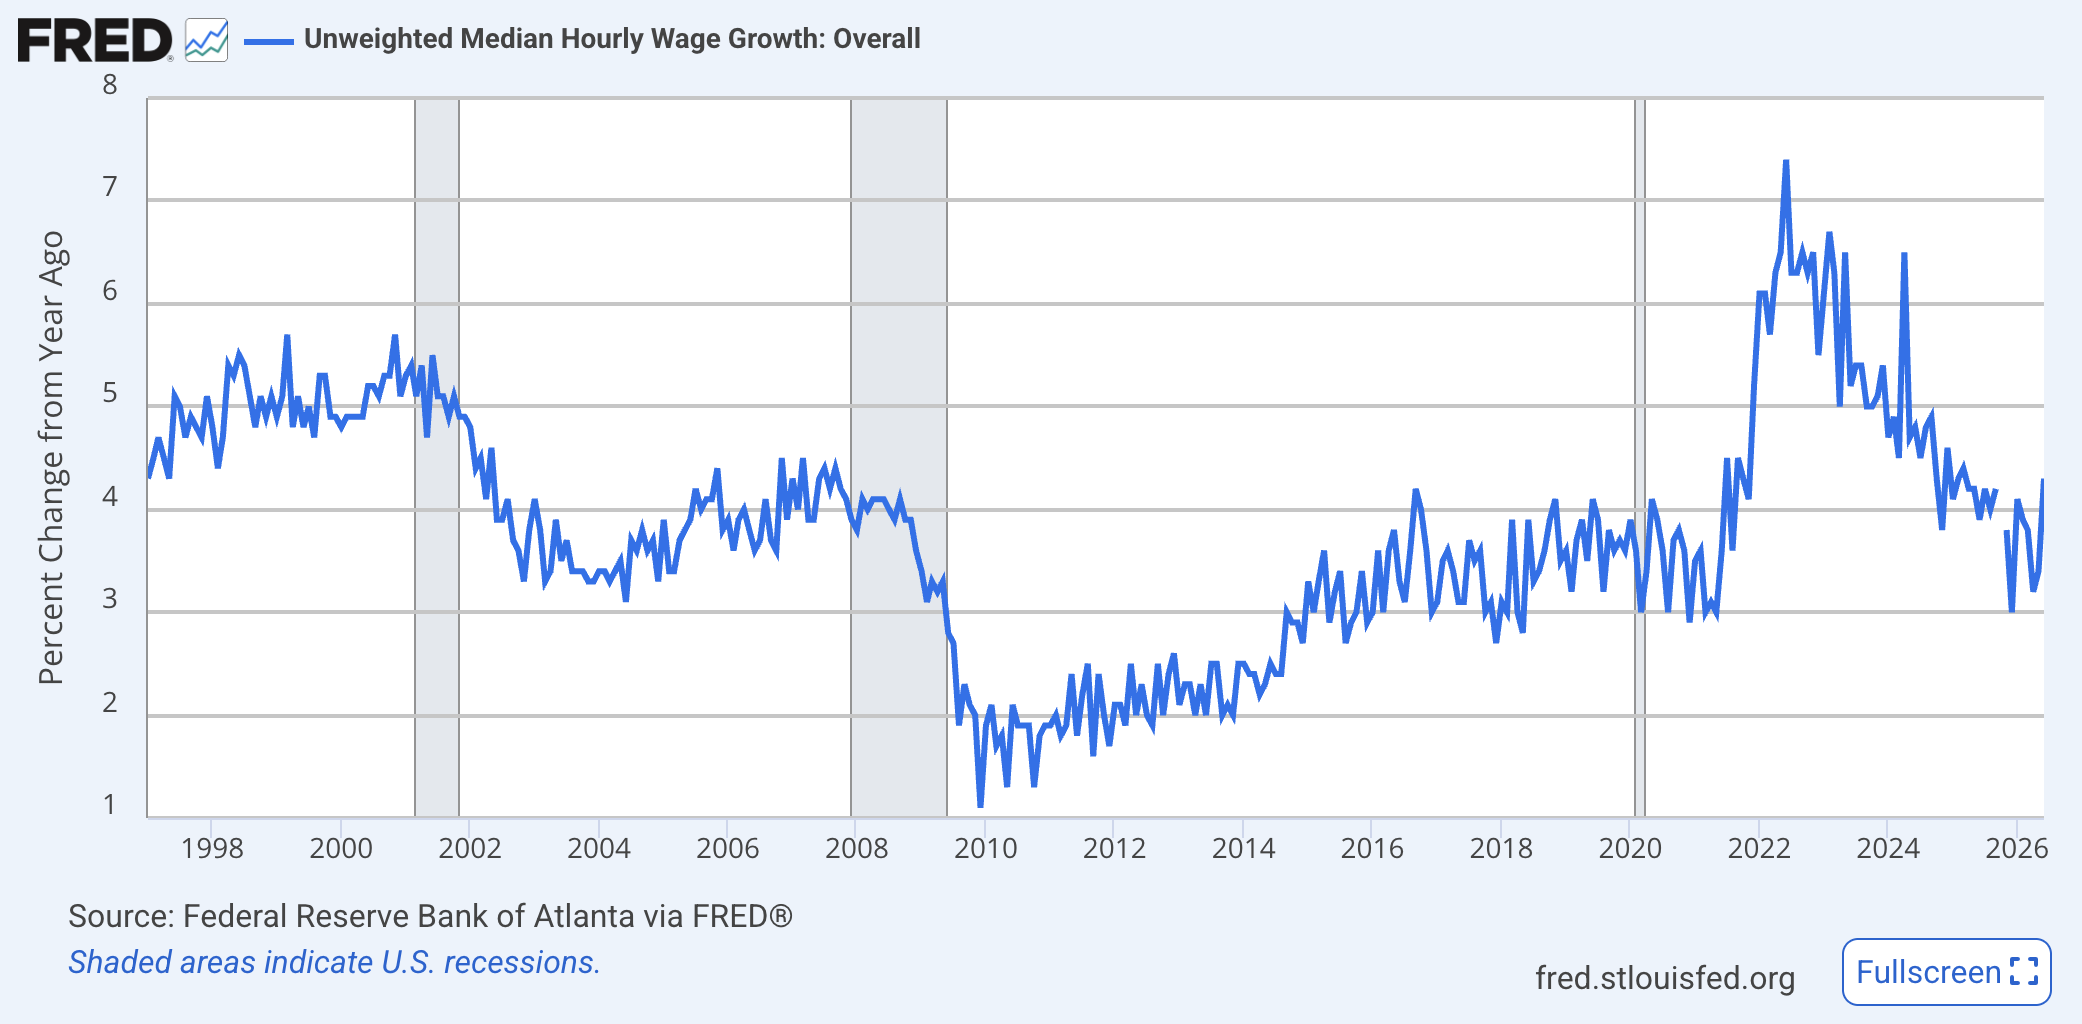
Since late 2020, many indicators have taken on what has been described as a “K” shape, showing a divergence in outcomes for two groups within the same category. Wage growth, for example, is increasing for those with higher incomes and decreasing for those with lower incomes. AI-related stocks are seeing much better returns than just about every other kind of stock. This bifurcation in the data matters because by many measures, the economy looks to be doing well, but digging into the data shows that for large swaths of America, the outlook may not be as robust as it seems.
Consumers are the primary engine of our economy, typically making up around 70% of GDP growth, meaning consumer spending is a metric that’s worth keeping an eye on.
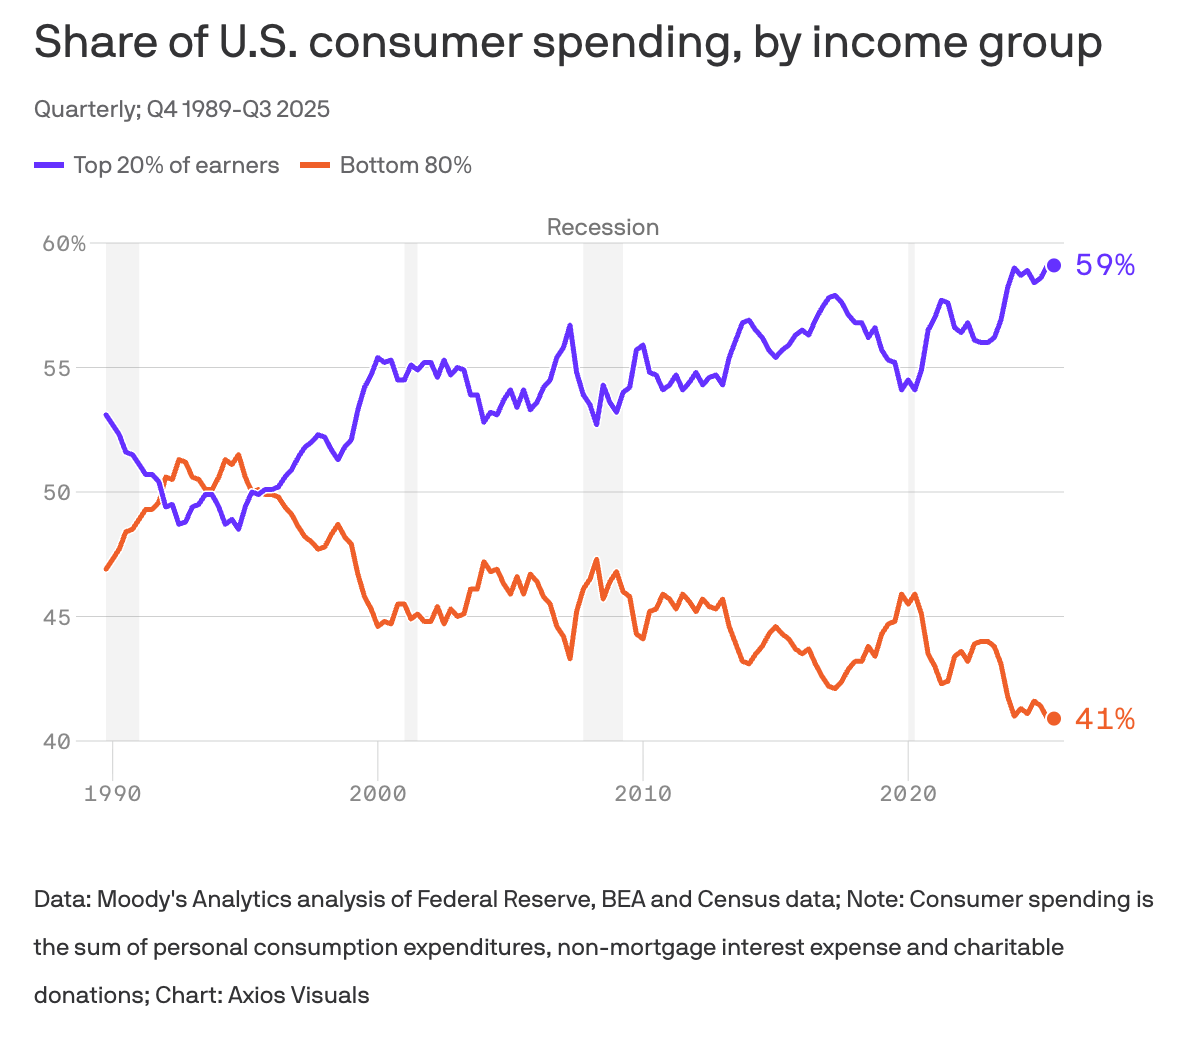
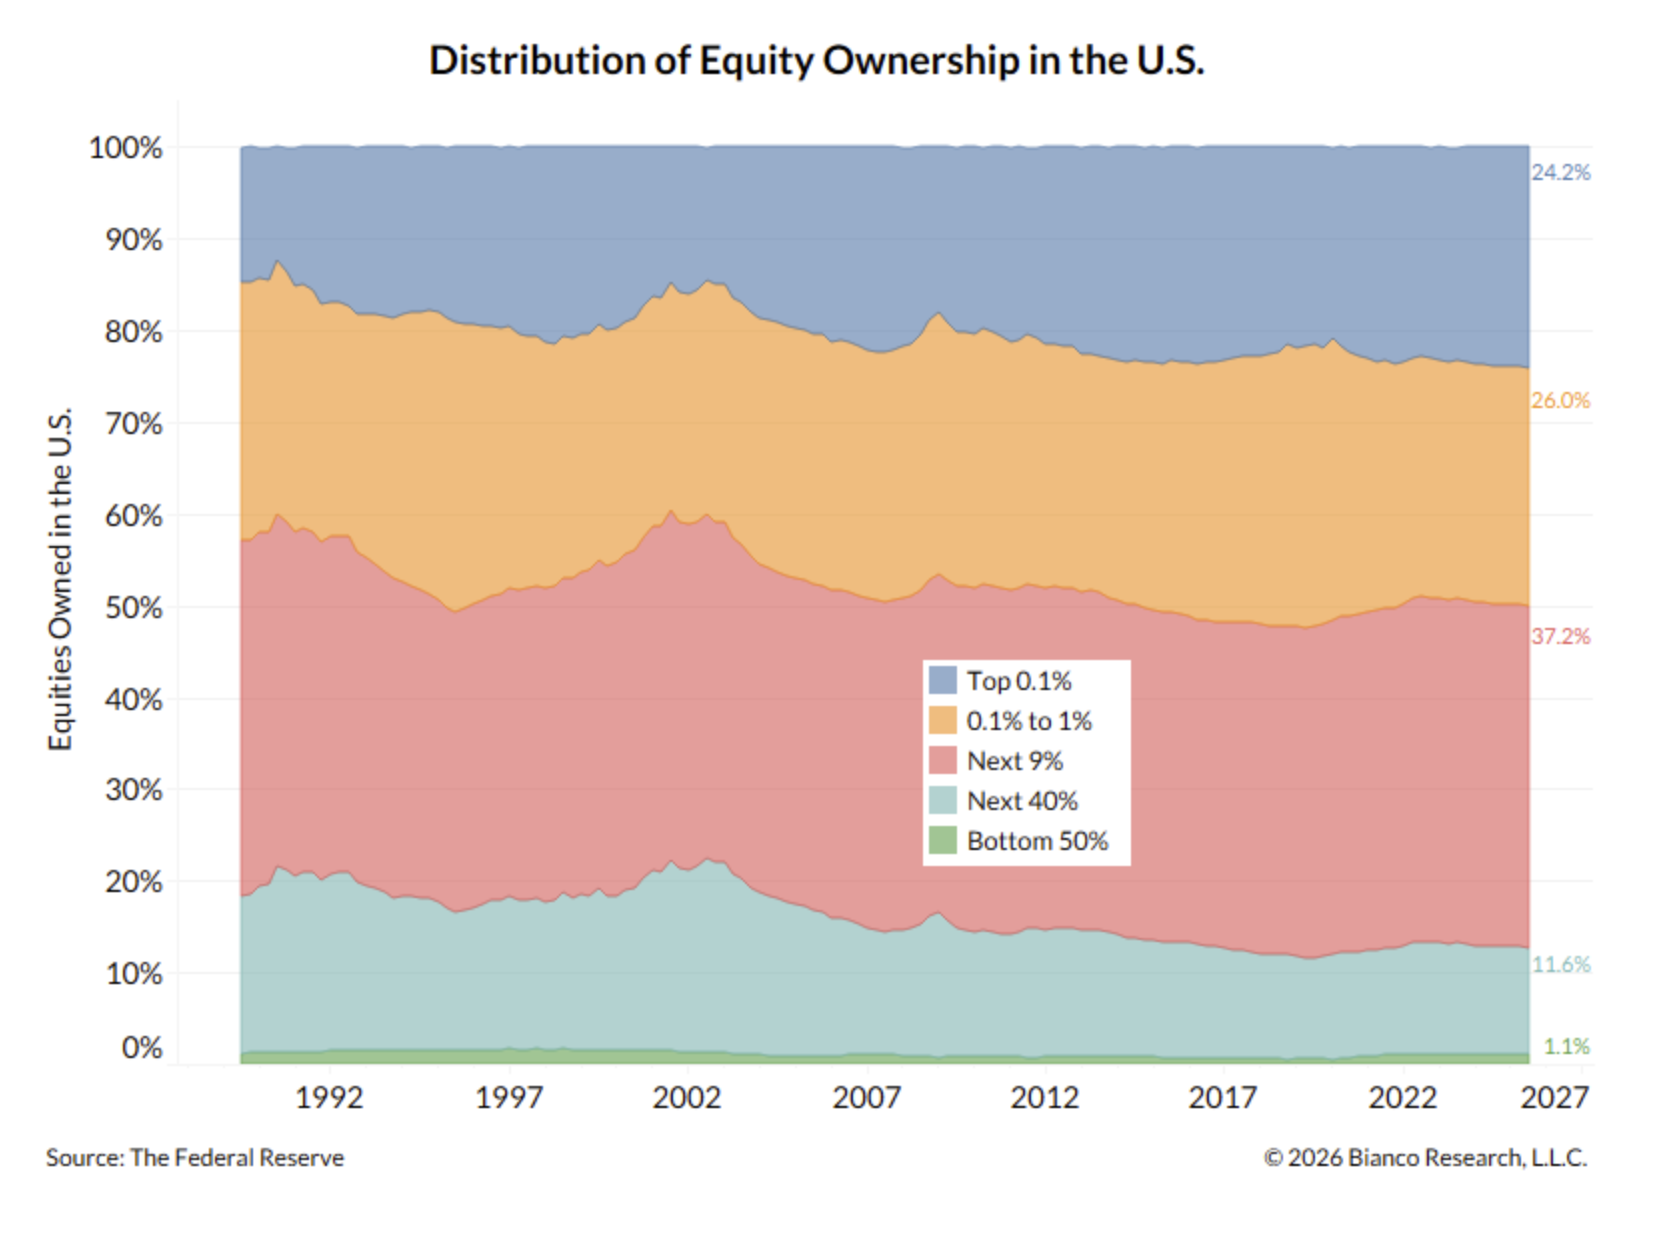
Higher income households account for a larger proportion of consumer spending than ever before. Part of that is driven by the wealth effect that comes from appreciating assets and the assets that are appreciating the most right now are AI and AI-related. That’s great news for anyone who owns those assets but who does? The wealthiest among us own the vast majority of stocks — the richest 10% own 87% of stocks while the bottom half of folks by wealth own virtually zero stocks, so the largest group of consumers benefits very little from any changes in equity asset values.2
That means that we have a much more fragile economy than usual right now. As mentioned above, the U.S. isn’t on the cusp of a recession but the cushion between expansion and contraction is narrowing.
The fragility is increasingly structural. Uncertainty levels are still elevated and hanging around like a fog. Tariffs, immigration policy,uneven rollout of AI and the infrastructure required to support it, turbulent demand for U.S. financial assets like Treasuries, and geopolitical risk all make planning harder. In response, firms shorten investment horizons, households delay big spending decisions, and hiring becomes more cautious.
The unemployment rate remains low, but job growth has slowed sharply, and the Philadelphia Federal Reserve’s forecasters expect payroll gains to average only about 34,600 per month in 2026, well below 2024’s 121,000 per month average and below the Congressional Budget Office’s (CBO) estimate of the current breakeven rate of 87,000 per month (the number of jobs that need to be added each month to keep the unemployment rate from ticking up).3 Though the number of jobs added each month have picked up, this is still a labor market that is in a slog. Hiring is tepid and the quits rate continues to trend downward. Firms are displaying the classic response to higher levels of uncertainty — a wait-and-see posture — while workers don’t have the confidence to look for a new job. All that leads to decreases in purchasing power since aggregate wage gains are struggling to keep up with inflation.
The Federal Reserve isn’t having a great time either. The CBO expects interest rates to remain above pre-pandemic averages, citing larger federal debt and stronger productivity as upward forces on real rates.4 At the same time, foreign demand for Treasuries is less assured, with China’s holdings declining meaningfully over the past year. The standard playbook assumed abundant savings and deep demand for U.S. debt. Now the Fed is left with a higher and harder-to-read floor under rates.
Inflation is still a thorn in the Federal Open Market Committee’s (FOMC) side. The energy market continues to add extra turbulence to prices across sectors and the possibility of a permanent cease-fire (that would allow the Strait of Hormuz to open in a fully-functional way) remains uncertain.
Tariffs are adding complexity once again as the 10% baseline rate for all trading partners may soon get increased under the auspices of Section 301 of the Trade Act of 1974. Those countries that the U.S. deems to have failed to properly enforce bans on goods made with forced labor will be subject to an additional 10-12.5% tariff, on top of the baseline 10%. Some 60 countries are currently being investigated for this new rate5
This is in addition to the sectoral tariffs still in place on things such as steel, aluminum, copper, and lumber. A 3% to 4% inflation environment may not be the baseline, but it is increasingly plausible.
What the Fed can do about all this is also worth noting. Rate hikes work on the demand side, making fewer people/businesses want to buy things but they can’t do much on the supply side like add housing, expand grid capacity, or rebuild inventories — where the help is really needed right now. AI compounds the challenge because the spending boom is immediate, while the productivity payoff is gradual. Analysts at the CBO and Oxford both point to AI-related investment as a support for growth, but the economy is paying the infrastructure bill before it receives the productivity dividend.6
There are historical parallels. The interstate highway system created a surge of public construction demand before its full economic benefits were realized through lower transportation costs, deeper labor markets, more efficient logistics, and new patterns of regional growth. Electrification and telecommunications followed similar arcs: first came years of capital spending, utility work, rights-of-way, equipment demand, and labor needs; only later did the broader productivity gains become fully visible. AI may follow the same basic sequence. The economy is paying for data centers, power generation, transmission, cooling systems, semiconductors, and skilled labor now, while the productivity dividend arrives later and unevenly. Infrastructure buildouts can raise long-run potential growth, but during the buildout phase they can also tighten capacity, lift construction demand, and keep pressure on specific materials and labor pools.
That timing problem is visible in power, semiconductors, data centers, and capital markets. The International Energy Agency expects electricity demand to keep rising rapidly through 2030, while market participants estimate U.S. data center power demand could roughly double from 2024 levels by 2030.7 Power availability, as opposed to capital, is becoming the bottleneck. These constraints show up in land values, transformer lead times, utility interconnections, permitting disputes, and construction costs. AI may lift potential growth, but the upfront strain is already shaping inflation and investment decisions.
Fiscal policy has less room as well. The federal deficit is projected to hit $1.9 trillion in 2026 with net interest outlays above $1 trillion.6 The U.S. still has powerful advantages, especially the dollar’s reserve status and depth of its capital markets. That advantage is not disappearing, but it is being tested at the margin as some countries settle more energy transactions outside the dollar and central banks diversify reserve holdings. For now, the bigger risk is not a sudden end to dollar dominance; it is a gradual rise in the cost of that dominance if investors demand more compensation to hold U.S. debt. More of each borrowed dollar now pays for past borrowing, and each shock arrives with less room for a clean fiscal response.
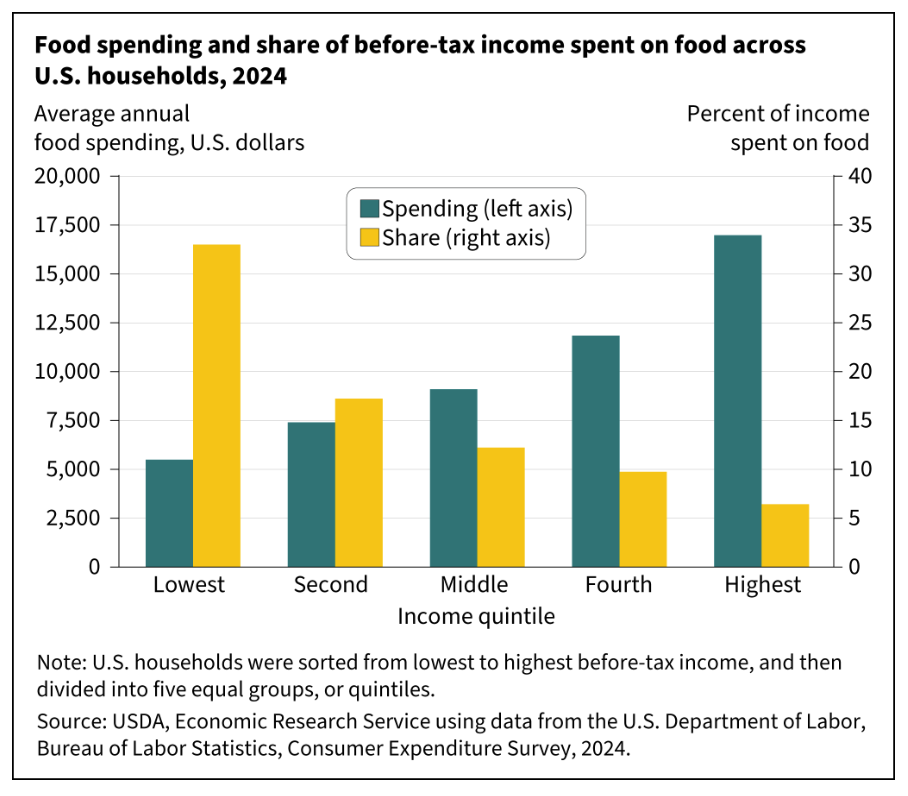
Inequality turns those structural pressures into macro vulnerabilities. Lower-income households have thinner cushions and spend more of their budgets on food, energy, housing, and goods, the categories most exposed to tariffs and commodity swings. When they pull back, the pain shows up quickly in discretionary categories and small businesses. A K-shaped economy can grow, but it has a narrower base and a weaker shock absorber.
The same pattern is emerging in nonresidential construction. AI and high-tech infrastructure still support business fixed investment, but activity is uneven. Census data show total nonresidential construction spending down 3.8% year over year in May 2026, with private nonresidential down 6.6%. ABC reports that private nonresidential spending fell for a seventh consecutive month, even as data center work continued to support firms exposed to that segment.8
That makes the construction outlook bifurcated rather than simply weak or strong. Data centers, power, select infrastructure, defense-adjacent work and AI-related manufacturing remain relative bright spots. Office, warehouse and more rate-sensitive private categories remain under pressure. Public construction is steadier, but fiscal limits will matter more as debt service competes with infrastructure, disaster relief, and defense priorities.
The baseline remains expansion with significant tailwinds: AI investment is substantial, fiscal policy still provides near-term support, households with investment portfolios can keep spending, and the Fed has room to ease if labor weakness intensifies. But the downside case is more complex than a normal cycle: sticky 4% to 5% inflation, prolonged energy market turmoil, outsized shifts in Treasury demand, or an AI-linked market correction could expose how narrow the expansion has become.
The best description for the back half of 2026 is a narrow runway in a structurally challenging economy. The U.S. still has deep capital markets, strong corporate balance sheets in key sectors, reserve-currency advantages and a dynamic technology base. But those strengths are increasingly concentrated. Growth can continue, but growth that depends too heavily on asset prices, AI capex, narrow labor-market resilience, and fiscal borrowing is vulnerable to shocks. For businesses, the task is to plan for expansion while preserving flexibility. For policymakers, it is to avoid mistaking positive GDP and low unemployment for broad economic health. The K-shaped economy has become the central risk to the outlook.